Quality control reports in the flow module can give you detailed insights into the statistics, data, and performance of your flow data, helping you to spot problems and find solutions. Monitoring controls within specified standard deviations can be done with Levey-Jennings plots. To generate a report:
- Click the Flow Tutorial link to return to the main folder page.
- Add a Flow Reports web part on the left.
- Click Create QC Report in the new Flow Reports web part.
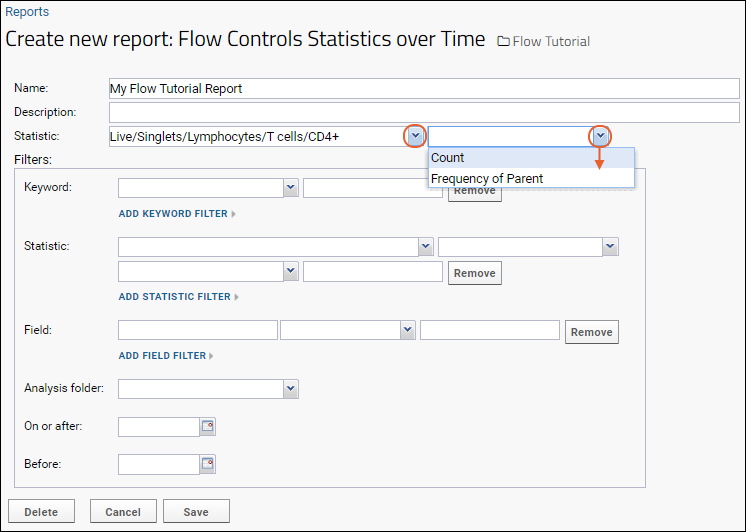
- Provide a Name for the report, and select a Statistic.
- Choose whether to report on Count or Frequency of Parent.
- In the Filters box, you can filter the report by keyword, statistic, field, folder, and date.

- Click Save.
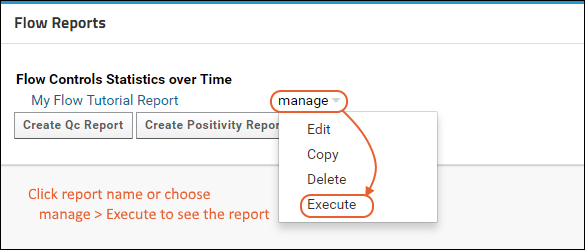
- The Flow Reports panel will list your report.
- Click the name to see the report. Use the manage link for the report to edit, copy, delete, or execute it.

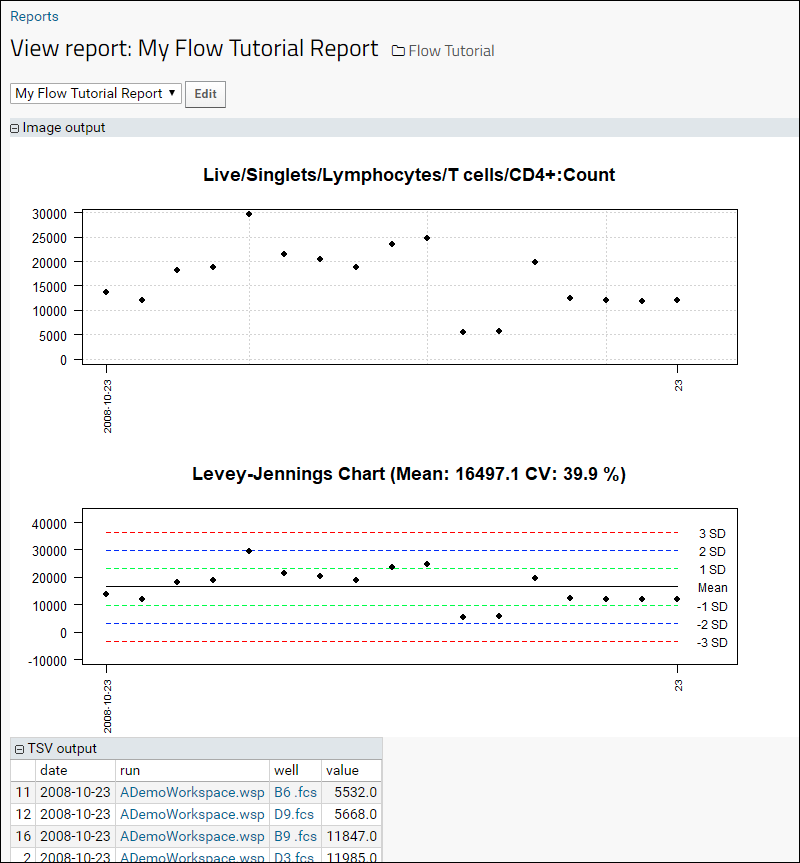
The report displays results over time, followed by a Levey-Jennings plot with standard deviation guide marks. TSV format output is shown below the plots.

Congratulations
You have now completed the
Tutorial: Explore a Flow Workspace. To explore more options using this same sample workspace, try this tutorial next:
