The Panorama QC folder is designed to help labs perform QC of their instruments and reagents over time. Runs are uploaded using the data pipeline or directly from Skyline. This topic describes how quality control guide sets can help track performance of metrics over time.
Quality Control Guide Sets
Guide sets give you control over which data points are used to establish the expected range of values in a QC plot. Instead of calculating the expected ranges based on all data points in the view, you can specify guide sets based on a subset of data points.
You create a guide set by specifying two dates:
- training start date
- training end date
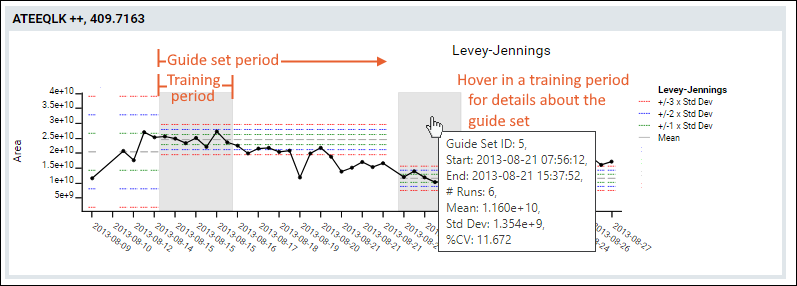
The training start and end dates (called the "training period") establish the period to calculate the expected range of values. The data points within the training period are used to calculate the mean and standard deviation for that guide set's expected range.
Standard deviations are shown as colored bars: green for +/-1, blue for +/-2, and red for +/-3 standard deviations from the mean. The expected range calculated by a training period is applied to all future data points, until a new training period is started.
The training periods are shown with a grey background. Hover over the training area to see detailed information about that guide set. You can also see these details on the
Guide Sets tab.

Define Guide Sets
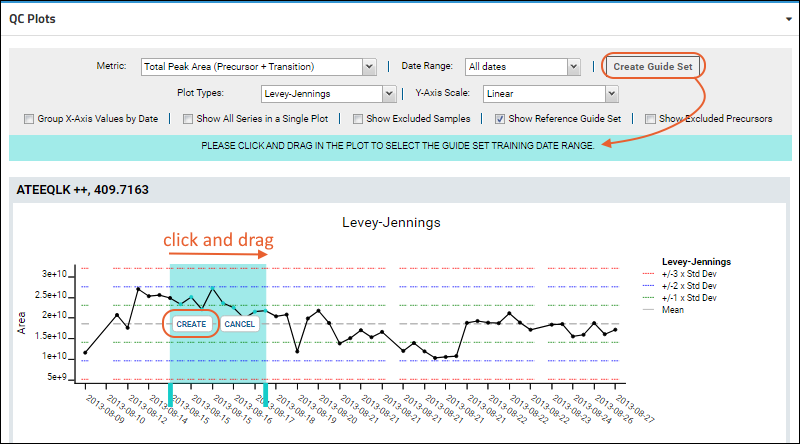
You can create guide sets directly from the QC plot. To add a new guide set, first
uncheck Group X-Axis Values by Date and
Show All Series in a Single Plot. Next click
Create Guide Set, drag to select an area directly on the graph, and click the
Create button that appears over the selected area.

Note: a warning will be given if fewer than 5 data points are selected, and you cannot create overlapping guide sets.
Alternatively, you can create guide sets by entering the start and end dates manually: click the
Guide Sets tab and click
Insert New to manually enter a new guide set. Note that you must have been granted the Editor role or greater to create guide sets from either of these two methods.
Edit or Delete Guide Sets
To edit or delete guide sets, click the tab
Guide Sets. To edit, hover over a row to reveal buttons for a guide set that has already been created. Click the
(pencil) icon to edit. To delete, check the target guide set and click the
(Delete) button.

Show Reference Guide Set
In any QC Plot display, use the
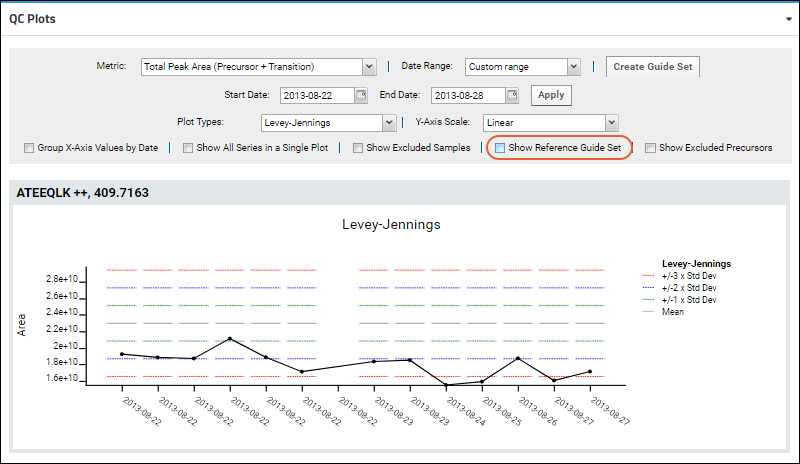
Show Reference Guide Set checkbox to always include the guide set data in QC plots. This box is checked by default.
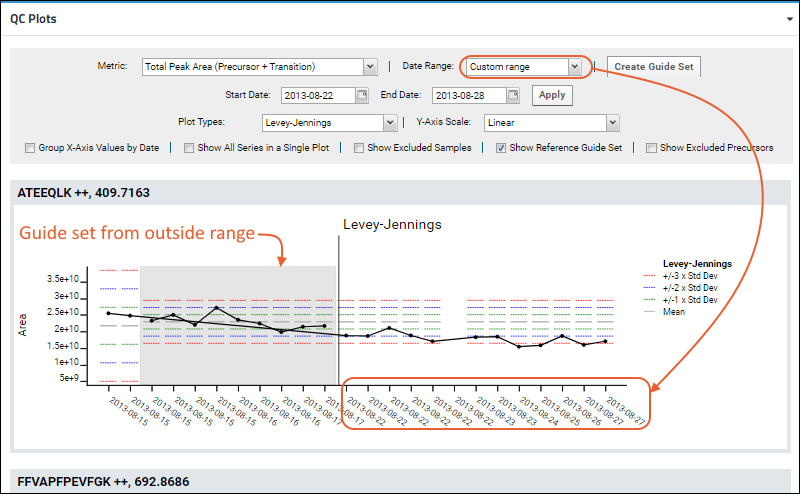
When zooming in to view QC data for a specific date range, the guide set data currently being used to identify outliers will always be shown, even if it is outside the plot date range.

The guide set is shaded in gray, and separated from the "selected" plot range by a vertical line.

Related Topics
