A JavaScript report links a specific data grid with code that runs in the user's browser. The code can access the underlying data, transform it as desired, and render a custom visualization or representation of that data (for example, a chart, grid, summary statistics, etc.) to the HTML page. Once the new JavaScript report has been added, it is accessible from the
(Reports) menu on the grid.
Note that you must have the
Platform Developer or Trusted Analyst role to add JavaScript reports.
Create a JavaScript Report
- Navigate to the data grid of interest.
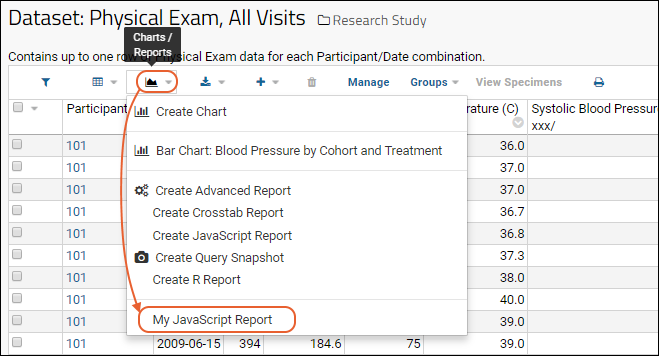
- Select (Reports) > Create JavaScript Report.
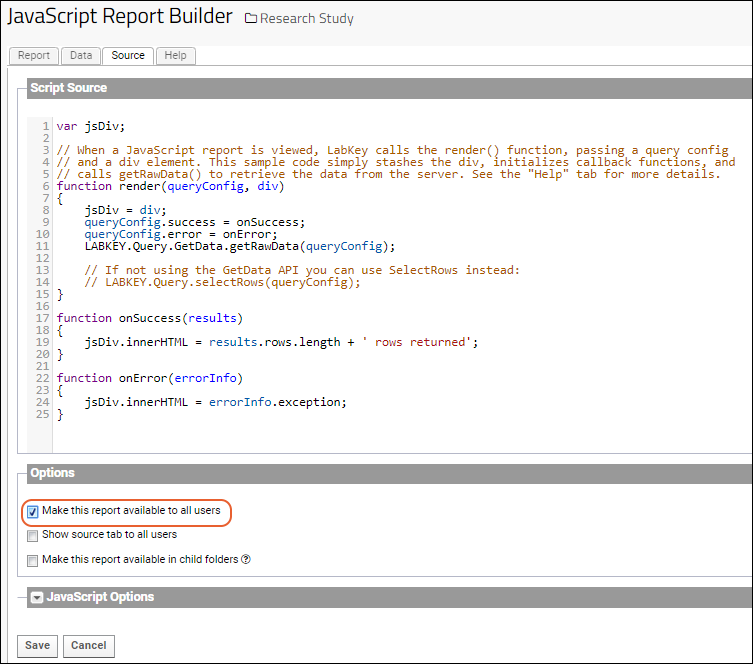
- Note the "starter code" provided on the Source tab. This starter code simply retrieves the data grid and displays the number of rows in the grid. The starter code also shows the basic requirements of a JavaScript report. Whatever JavaScript code you provide must define a render() function that receives two parameters: a query configuration object and an HTML div element. When a user views the report, LabKey Server calls this render() function to display the results to the page using the provided div.
- Modify the starter code, especially the onSuccess(results) function, to render the grid as desired. See an example below.

- If you want other users to see this report, place a checkmark next to Make this report available to all users.
- Elect whether you want the report to be available in child folders on data grids where the schema and table are the same as this data grid.
- Click Save, provide a name for the report, and click OK.
- Confirm that the JavaScript report has been added to the grid's Reports menu.

GetData API
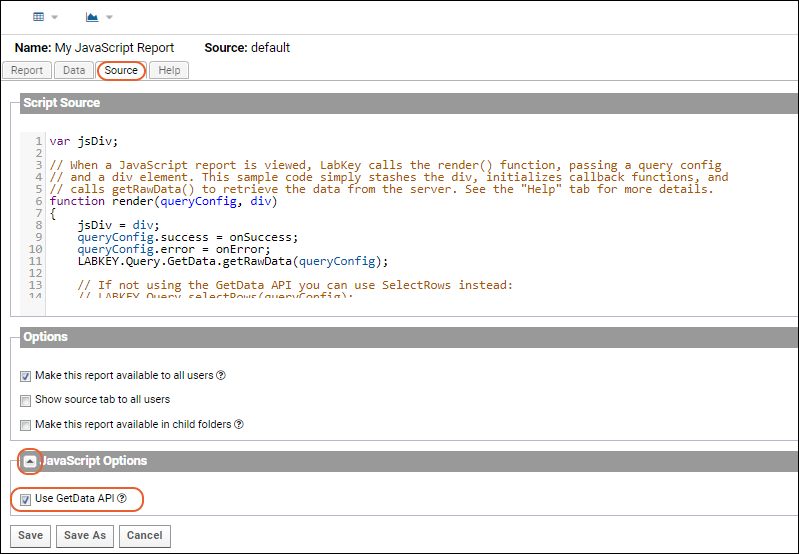
There are two ways to retrieve the actual data you wish to see, which you control using the
JavaScript Options section of the source editor, circled in red at the bottom of the following screenshot.

- If Use GetData API is selected (the default setting), you can pass the data through one or more transforms before retrieving it. When selected, you pass the query config to LABKEY.Query.GetData.getRawData().
- If Use GetData API is not selected, you can still configure columns and filters before passing the query config directly to LABKEY.Query.selectRows()
Modify the Query Configuration
Before the data is retrieved, the query config can be modified as needed. For example, you can specify filters, columns, sorts, maximum number of rows to return, etc. The example below specifies that only the first 25 rows of results should be returned:
queryConfig.maxRows = 25;
Your code should also add parameters to the query configuration to specify functions to call when selectRows succeeds or fails. For example:
. . .
queryConfig.success = onSuccess;
queryConfig.error = onError;
. . .

function onSuccess(results)
{
. . .Render results as HTML to div. . .
}

function onError(errorInfo)
{
    jsDiv.innerHTML = errorInfo.exception;
}
JavaScript Scope
Your JavaScript code is wrapped in an anonymous function, which provides unique scoping for the functions and variables you define; your identifiers will not conflict with identifiers in other JavaScript reports rendered on the same page.
Example
This example can be attached to any dataset or list. To run this sample, select a dataset or list to run it against, create a JavaScript report (see above), pasting this sample code into the
Source tab.
var jsDiv;

// When the page is viewed, LabKey calls the render() function, passing a query config
// and a div element. This sample code calls selectRows() to retrieve the data from the server,
// and displays the data inserting line breaks for each new row.
// Note that the query config specifies the appropriate query success and failure functions
// and limits the number of rows returned to 4.
function render(queryConfig, div)
{
    jsDiv = div;
    queryConfig.success = onSuccess;
    queryConfig.error = onError;
    // Only return the first 4 rows
    queryConfig.maxRows = 4;
    LABKEY.Query.GetData.getRawData(queryConfig);
    //LABKEY.Query.selectRows(queryConfig);
}

function onSuccess(results)
{
    var data = "";

    // Display the data with white space after each column value and line breaks after each row.
    for (var idxRow = 0; idxRow < results.rows.length; idxRow++)
    {
        var row = results.rows[idxRow];

    for (var col in row)
    {
        if (row[col] && row[col].value)
        {
            data = data + row[col].value + " ";
        }
    }

        data = data + "<br/>";
    }

    // Render the HTML to the div.
    jsDiv.innerHTML = data;
}

function onError(errorInfo)
{
    jsDiv.innerHTML = errorInfo.exception;
}
Related Topics

