The
Admin Console is a site dashboard consolidating many management services including the following:
- Customize the LabKey site, including configuration and customization of many settings.
- View detailed information about the system configuration and installed modules.
- View diagnostic information about memory usage and more.
- Audit a wide range of server activities from user logins to file actions to queries executed.
Topics
Access the Admin Console
The Admin Console can be accessed by
Site Administrators:
- At the top right of your screen, select (Admin) > Site > Admin Console.
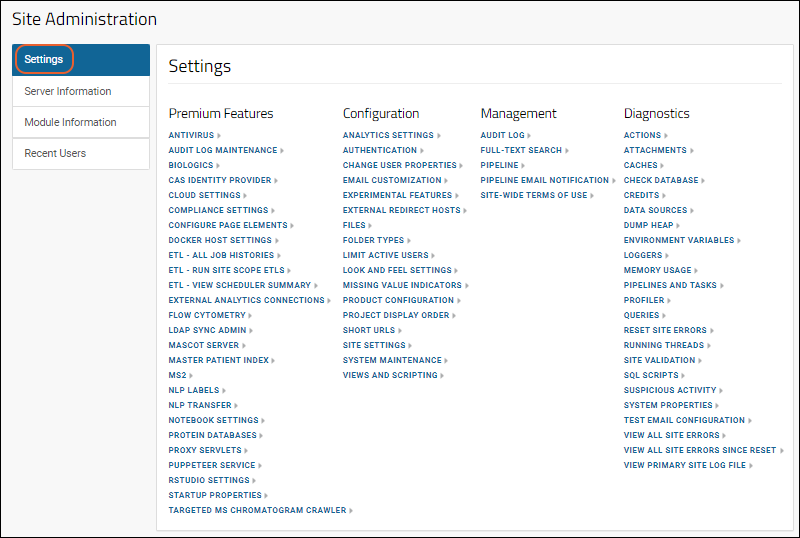
- Most of the administration actions are configured on the Settings tab, which opens by default.

Admin Console Settings Tab
A variety of tools and information resources are provided on the Admin Console in several categories of links:
Premium Features
The section for
Premium Features will include some or all of the following features, as well as possibly additional features, depending on the edition you are running and the modules you have configured.
Learn more about premium editions
Configuration
- Analytics Settings: Add JavaScript to your HTML pages to enable Google Analytics or add other custom script to the head of every page. Additional details are provided in the UI.
- Authentication: View, enable, disable and configure authentication providers (e.g. Database, LDAP, CAS, Duo). Configure options like self sign-up and self-service email changes.
- Change User Properties: Edit fields in the Users table.
- Email Customization: Customize auto-generated emails sent to users.
- Experimental Features: Offers the option to enable experimental features. Proceed with caution as no guarantees are made about the features listed here.
- External Redirect Hosts: Configure a list of allowable external targets of redirect URLs.
- Files: Configure file system access by setting site file root and configuring file and pipeline directories.
- Folder Types: Select which folder types will be available for new project and folder creation. Disabling a folder type here will not change the type of any current folders already using it.
- Limit Active Users
- Look and Feel Settings: Customize colors, fonts, formats, and graphics.
- Missing Value Indicators: Manage indicators for datasets.
- Project Display Order: Choose whether to list projects alphabetically or specify a custom order.
- Short URLs: Define short URL aliases for more convenient sharing and reference.
- Site Settings: Configure a variety of basic system settings, including the base URL and the frequency of system maintenance and update checking.
- System Maintenance: These tasks are typically run every night to clear unused data, update database statistics, perform nightly data refreshes, and keep these server running smoothly and quickly. We recommend leaving all system maintenance tasks enabled, but some of the tasks can be disabled if absolutely necessary. By default these tasks run on a daily schedule. You can change the time of day which they run if desired. You can also run a task on demand by clicking one of the links. Available tasks may vary by implementation but could include:
- Audit Log Maintenance
- Clean Up Archived Modules
- Compliance Account Maintenance
- Database Maintenance
- Defragment ParticipantVisit Indexes
- Master Patient Index Synchronization
- Project Review Workflow
- Purge Expired API Keys
- Purge Stale RStudio Docker Containers
- Purge Unused Participants
- Remove Orphaned Attachments on Notebook Entries
- Report Service Maintenance
- Search Service Maintenance
- Views and Scripting: Allows you to configure different types of scripting engines.
Management
Diagnostics
Links to diagnostic pages and tests that provide usage and troubleshooting information.
- Actions: View information about the time spent processing various HTTP requests.
- Attachments: View attachment types and counts, as well as a list of unknown attachments (if any).
- Caches: View information about caches within the server.
- Check Database: Options for checking the database:
- Check table consistency: Click Do Database Check to access admin-doCheck.view which will: check container column references, PropertyDescriptor and DomainDescriptor consistency, schema consistency with tableXML, consistency of provisioned storage. Some warnings here are benign, such as expectations of a 'name' field in Sample Types (that can now use SampleID instead), or 'orphaned' tables that are taking up space and can be safely deleted.
- Validate domains match hard tables: Click Validate to run a background pipeline job looking for domain mismatches.
- Get schema XML doc: Select a schema and click to Get Schema Xml.
- Credits: Jar and Executable files distributed with LabKey Server modules.
- Data Sources: A list of all the data sources defined in labkey.xml that were available at server startup and the external schemas defined in each. Learn about testing external data sources here.
- Dump Heap: Write the current contents of the server's memory to a file for analysis.
- Environment Variables: A list of all the current environment variables and their values, for example, JAVA_HOME and your PATH will be shown
- Loggers: Manage the logging level of different LabKey components here. For example, while investigating an issue you may want to set a particular logging path to DEBUG to cause that component to emit more verbose logging.
- Memory Usage: View current memory usage within the server. You can clear caches and run garbage collection from this page.
- Pipelines and Tasks: See a list of all registered pipelines and tasks. This list may assist you in troubleshooting pipeline issues. You will also see TaskId information to assist you when building ETL scripts.
- Profiler: Configure development tools like stack trace capture and performance profiling.
- Queries: View the SQL queries run against the database, how many times they have been run, and other performance metrics.
- Reset Site Errors: Reset the start point in the labkey-errors.log file when you click View All Site Errors Since Reset later, nothing prior to the reset will be included. You will need to confirm this action by clicking OK.
- Running Threads: View the current state of all threads running within the server. Clicking this link also dumps thread information to the log file.
- Site Validation: Runs any validators that have been registered. (Validators are registered with the class SiteValidationProvider.)
- SQL Scripts: Provides a list of the SQL scripts that have run, and have not been run, on the server. Includes a list of scripts with errors, and "orphaned" scripts, i.e., scripts that will never run because another script has the same "from" version but a later "to" version.
- Suspicious Activity: Records any activities that raise 404 errors, including but not limited to things like attempts to access the server from questionable URLs, paths containing "../..", POST requests not including CSRF tokens, or improper encoding or characters.
- System Properties: A list of current system properties and their values. For example, if you see "devmode = true", this means that the server is in "Development" mode. If you do not see this property, you are in "Production" mode. Do not use development mode on a production server.
- Test Email Configuration: View and test current SMTP settings. See Migrate Configuration to Application Properties for information about setting them.
- View All Site Errors: View the current contents of the labkey-errors.log file from the <LABKEY_HOME>/logs directory, which contains critical error messages from the main labkey.log file.
- View All Site Errors Since Reset: View the contents of labkey-errors.log that have been written since the last time its offset was reset through the Reset Site Errors link.
- View Primary Site Log File: View the current contents of the labkey.log file from the <LABKEY_HOME>/logs directory, which contains all log output from LabKey Server.
Server Information Tab
The other tabs in the admin console offer grids of detailed information:
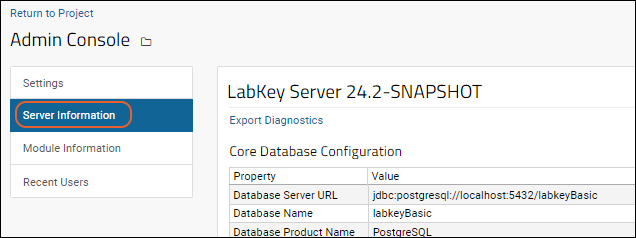
- Server Information: Core database configuration and runtime information.
- The version of the server is displayed prominently at the top of the panel.
- Users of Premium Editions can click to Export Diagnostics from this page.
- Core Database Configuration: Details about the database, drivers, and connection pools.
- Runtime Information: Details about component versions, variable settings, and operation mode details, such as the setting of the Session Timeout (in minutes).

Many of the server properties shown on the Server Information Tab can be substituted into the
Header Short Name on the
Look and Feel settings page. This can be useful when developing with multiple servers or databases to show key differentiating properties on the page header.
Server and Database Times
On the
Server Information tab, under
Runtime Information you'll see the current clock time on both the web server and database server. This can be useful in determining the correct time to check in the logs to find specific or actions.
Note that if the two times differ by more than 10 seconds, you'll see them displayed in red with an alert message: "Warning: Web and database server times differ by ## seconds!"

The administrator should investigate where both servers are retrieving their clock time and align them. When the server and database times are significantly different, there are likely to be unwanted consequences in audit logging, job synchronization, and other actions.
Error Code Reporting
If you encounter an error or exception, it will include a unique
Error Code that can be matched with more details submitted with an error report. When reporting an issue to LabKey support, please include this error code. In many cases LabKey can use this code to track down more information with the error report, as configured in
Site Settings.
Module Information Tab
Module Information: Detailed version information for installed modules.
Click
Module Details for a grid of additional details about all modules known on the server.
- At the bottom of the Module Details page, you'll see a grid of Unknown Modules (if any).
- A module is considered "unknown" if it was installed on this server in the past but the corresponding module file is currently missing or invalid.
- Unknown modules offer a link to Delete Module or Delete Module and Schema when the module also has an accompanying schema that is now "orphaned".
- Professional and Enterprise Editions of LabKey Server may also offer module loading and editing from the Module details page.
Recent Users Tab
- Recent Users: See which users have been active in the last hour
Related Topics
 Many of the server properties shown on the Server Information Tab can be substituted into the Header Short Name on the Look and Feel settings page. This can be useful when developing with multiple servers or databases to show key differentiating properties on the page header.