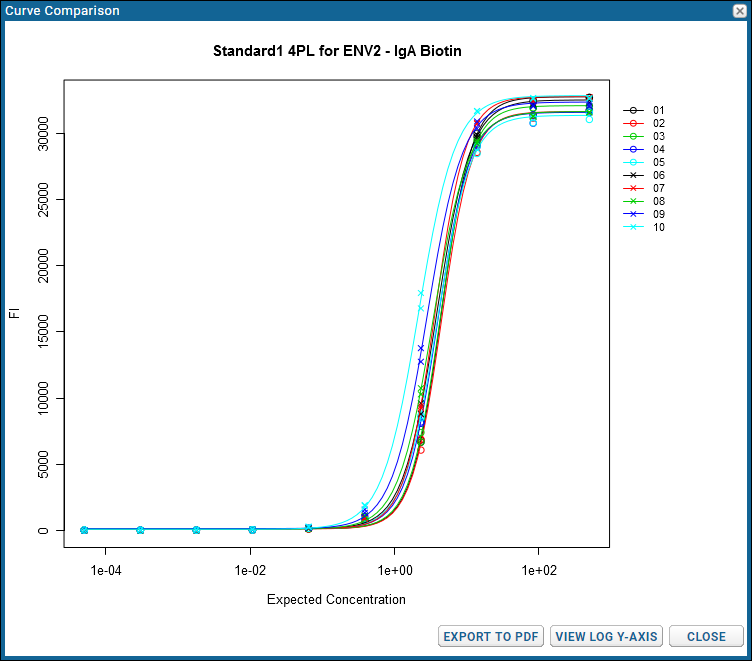
Plotting standard curves for several runs together helps visualize any inconsistencies in data and curve fits between runs. The resulting overlay plot is sometimes called a curve "graveyard."
Here, we generate an overlay plot for the 4pl standard titration curves for the same data used in the previous steps (
Step 5: Track Analyte Quality Over Time and
Step 7: Use Guide Sets for QC).
Steps
Return to the Levey-Jennings plot for the ENV2 standard:
- Go to the Assay Dashboard.
- Click Luminex Assay 200.
- Select View QC Report > view levey-jennings reports.
- Click Standard1.
- In the Choose Graph Parameters box, select Antigen "ENV2", Isotype "IgA", Conjugate "Biotin" and click Apply.
Next, create the overlay plot:
- Scroll down to the Standard1 Tracking Data for ENV2 - IgA Biotin table.
- Selects all rows. (Click the box at the top of the left hand column.)
- Click View 4pl Curves to generate the overlay plot.

Using the buttons in the
Curve Comparison popup, you can:
- View Log Y-Axis - Switch between a logarithmic and linear Y-axis. The button will read View Linear Y-Axis when viewing the log(FI) version.
- Export to PDF - Export the overlay plot. The exported pdf includes both FI and log(FI) versions. View a sample here.
- Close the plot when finished.
Congratulations! You have completed the Luminex Tutorial Level II.
Related Topics