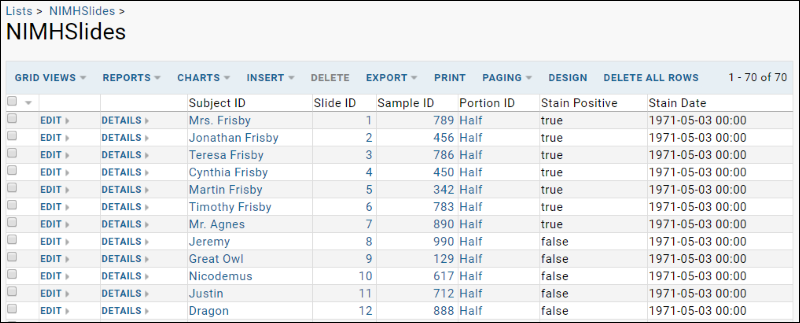
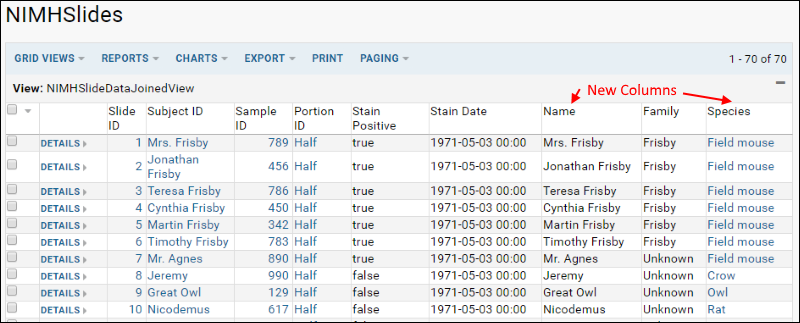
The imported list archive includes four lists interconnected with some specific fields which are defined as lookups to other lists, allowing us to create joins between these lists. Setting up lookups between lists pays off when we investigate our experimental results in the NIMHSlides list. The Slides list shows an interesting pattern in positive/negative stains, but you won't see this pattern unless you first join in some information from another list (Demographics).
- Click the NIMHSlides list from the Start Page tab.

The grid shows all the uploaded slide data. You may or may not be able to spot a pattern at this point. Familiarity with the novel might help in this very simple example, but we can also use additional data to help us.
Create a Joined Grid
- Select Grid Views > Customize Grid.
- Expand SubjectID by clicking on the "+" next to it.
- Place checkmarks next to the Name, Family, and Species fields. (Note that these fields are added to the Selected Fields pane.)
- Click Save and name this view NIMHSlideDataJoinedView
- Click Save.
- You'll now see additional columns in the grid view. To view an interactive example, see: NIMHSlideDataJoinedView

Find a Pattern in the Data
Do positive/negative stains correlate with any other characteristics in our subjects?
First, let's do the simplest possible data analysis: sorting the data.
- Click the column header Stain Positive to bring up a menu of sorting and filter options.
- Choose Sort Descending.
- Examine the results and notice that almost all of the positive stains came from field mice.
- Looks like we have a pattern worth further investigation.

