The
Data Views web part displays a catalog of available queries and reports. This provides a convenient dashboard for selecting among the available ways to view data in a given folder or project. In a
Study the Data Views web part also includes datasets and customized data grids that have been saved.
Add Data Views Browser
To add the Data Views web part to a page:
- Select Data Views from the <Select Web Part> pulldown in the lower left.
- Click Add.
By default, the
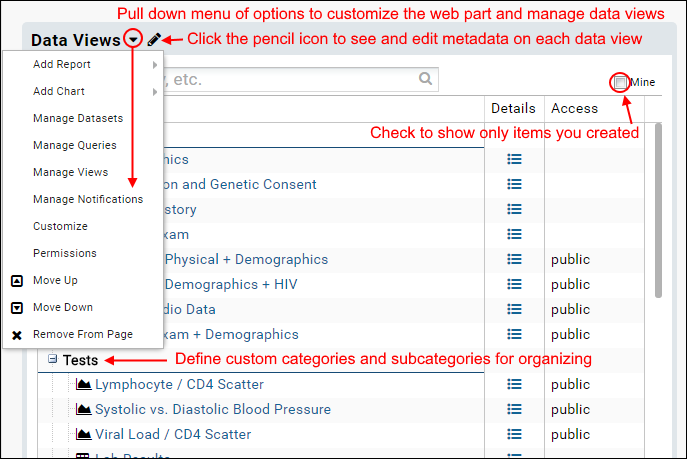
Data Views web part lists all the queries, reports, and datasets you have permission to read. If you would like to view only the subset of items you created yourself, click the
Mine checkbox in the upper right. Depending on permissions, you can customize both the web part itself and the metadata about individual reports and views.

- Add Report and Add Chart: Add new reports and charts directly.
- Manage Datasets: Create and manage study datasets.
- Manage Queries: Open the query schema browser.
- Manage Views: Manage reports, queries, and grids, including the option to delete multiple items at once.
- Manage Notifications: Subscribe to receive notifications of report and dataset changes.
- Customize: Customize this web part.
- Permissions: Control who can see this web part.
- Move Up/Down: Change the sequence of web parts on the page.
- Remove From Page: No longer show this web part - note that the underlying data is not affected by removing the web part.
Customize Data Views Browser
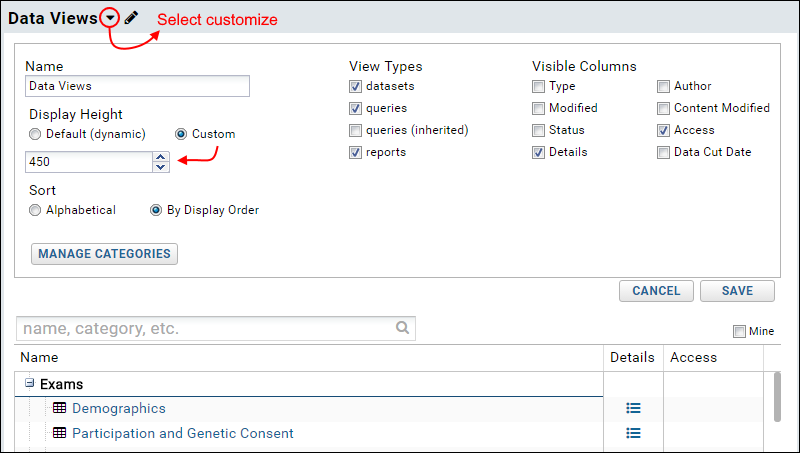
Select
Customize from the triangle pulldown menu to change the following:
- Name: the heading of the web part (the default is "Data Views").
- Display Height: adjust the size of the web part. Options:
- Default (dynamic): by default, the data views browser is dynamically sized to fit the number of items displayed, up to a maximum of 700px.
- Custom: enter the desired web part height. Must be between 200 and 3000 pixels.
- Upgrade note: if an existing data views webpart used one of the prior small, medium, or large options, that height setting will be preserved as a custom height.
- Sort: select an option:
- By Display Order: the default: the order items are returned from the database
- Alphabetical: alphabetize items within categories; categories are explicitly ordered
- View Types: check or uncheck boxes to control whether reports, queries, or datasets are displayed.
- Visible Columns: check and uncheck boxes to control which columns appear in the web part.
- Manage Categories: Click to define and use categories and subcategories for grouping.

- To close the Customize box, select Save or Cancel.
Toggle Edit Mode
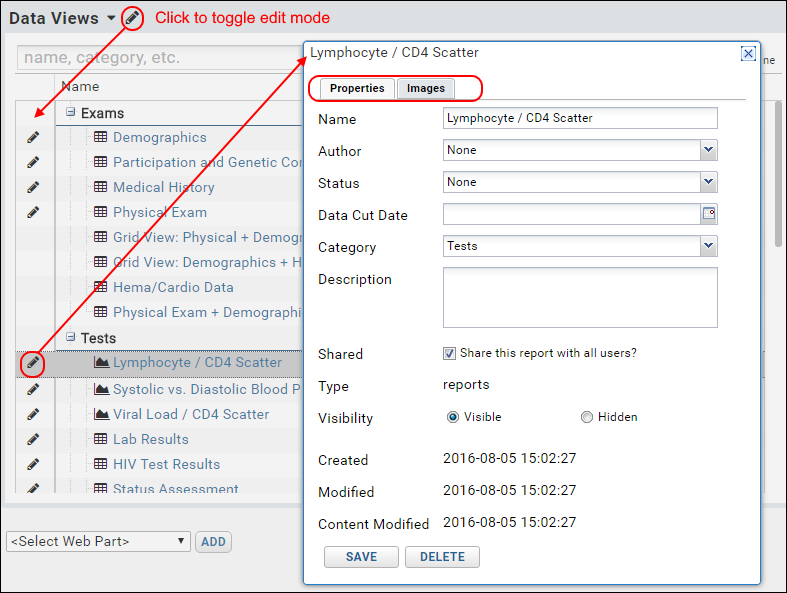
- Click the pencil icon in the webpart border to toggle edit mode. Individual pencil icons show which items have metadata you can edit here.
- When active, click the pencil icon for the desired report or query.

- Edit Properties, such as status, author, visibility to others, etc.
- If you want to move the item to a different section of the web part, select a different Category.
- If there are associated thumbnails and mini-icons, you can customize them from the Images tab. See Manage Thumbnail Images for more information.
- Click Save.
Notice that there are three dates associated with reports: the creation date, the date the report itself was last modified, and the date the content of the report was last modified.
Related Topics
