When processing is complete, you will see a grid including two runs, one for the compensation step and another for the analysis step. If you are not working through the tutorial steps on a local server, you can view in the
interactive flow demo.
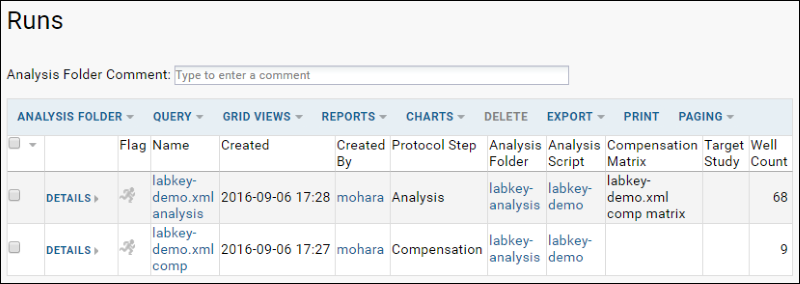
You can also reach this grid from the
Flow Dashboard and clicking
labkey-analysis in the
Flow Analyses web part.
Show Statistics in the Grid
- On the labkey-analysis > Runs page, click the Name "labkey-demo.xml analysis" to show the default data grid for the analysis.
- Select Grid Views > Customize Grid and click the + by "Statistic" in the available fields panel.
- Scroll down to see currently selected fields, and select other statistics you would like shown.
- Drag and drop these rows within on the Selected Fields panel to be in your preferred order. Note that if you make changes here, your results may not match our tutorial screencaps. Click View Grid then reopen for editing to see your customization in progress.
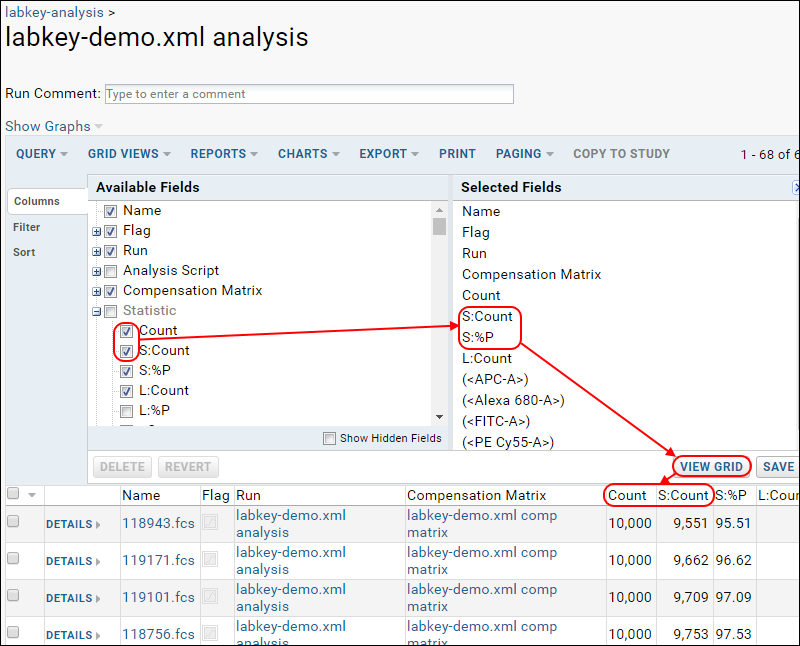
- Remove any you would not like shown from selected fields by hovering over the field name and clicking the 'x' on the right.
- Note that these statistics have been calculated using the LabKey Flow engine (instead of simply read from a file, as they are when you import a workspace).
- Save the grid view as you like it by clicking Save, entering a name, such as "MyStatistics", and clicking Save in the pop-up.
The statistics grid for the online flow demo is available
here and shown in the screen shot in the next section without graphs.
Add Graphs
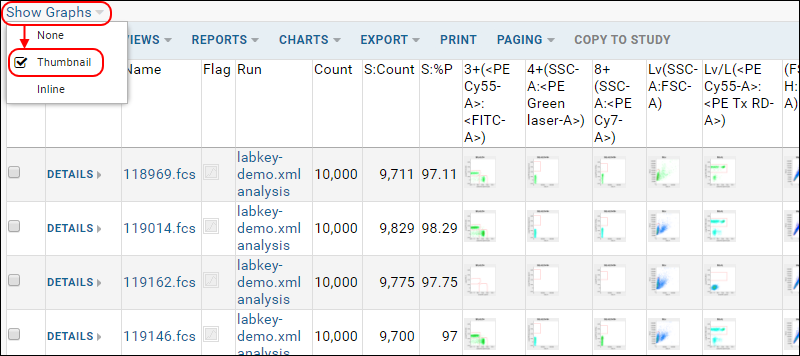
You can add graphs in line or as thumbnails in columns next to statistics.
- Select Grid Views > Customize Grid and open the "Graph" node.
- Scroll and select which graphs will be available.
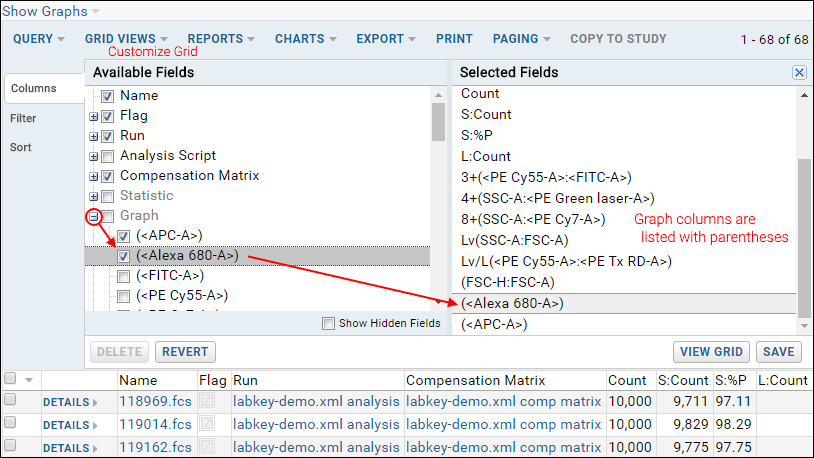
- Save or use "View Grid" to view without saving.
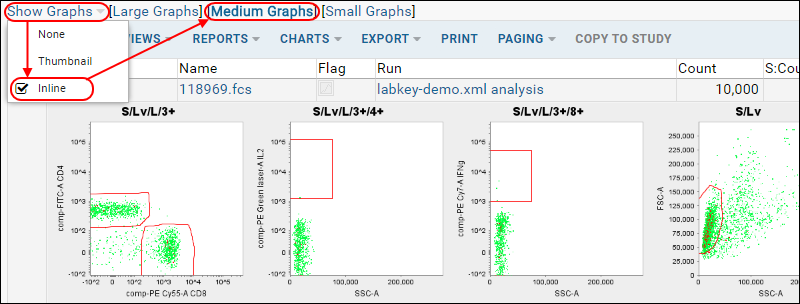
- Click on the Show Graphs link above the grid to select how you want to see graphs. Options:
- None
- Thumbnails
- Inline - inline graphs may be viewed in three sizes.
Example grids with graphs are shown below.
Show the Compensation Controls
- In Flow Dashboard > Flow Analyses web part, click labkey-analysis.
- On the "Runs" page, click on "labkey-demo.xml comp" to show the compensation controls.
- The compensation controls page for the flow demo is available here and shown in the screen shot below:
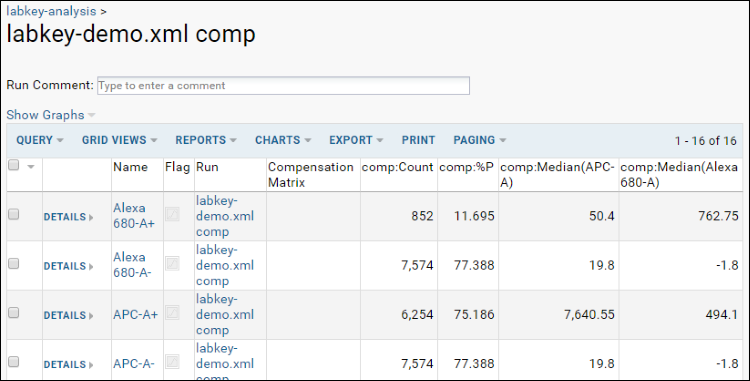
On the compensation controls page you can also "Show Graphs" as with statistics.
Flow Reports
There are two types of reports available. Return to the
Flow Dashboard and add a
Flow Reports web part, then click the create button for either type of report:
QC Reports
Provide a name and select available statistics and filters to apply. Select the analysis folder and specify a date range as well to produce the desired quality control report.
Positivity Reports
A positivity report requires metadata describing the sample and background information of the flow experiment before it can be run. Select statistics and filters and a date range. Click
Save and the report will be displayed.