Access Your Dataset as “labkey.data”
LabKey Server automatically reads your chosen dataset into a data frame called
labkey.data; using
Input Substitution.
A data frame can be visualized as a list with unique row names and columns of consistent lengths. Columns may also be named and their types may differ. You can see the column names for the labkey.data frame by calling:
options(echo=TRUE);
names(labkey.data);
Just like any other data.frame, data in a column of labkey.data can be referenced by the column’s name, preceded by a $:
labkey.data$<column name>
For example:
labkey.data$pulse; provides all the data in the Pulse column of the Physical Exam sample dataset.
Note that the examples in this section frequently include column names. If you are using your own data or a different version of LabKey sample data, you may need to retrieve column names and edit the code examples given.
Use Pre-existig R Scripts
To use a pre-existing R script with LabKey data, try the following procedure:
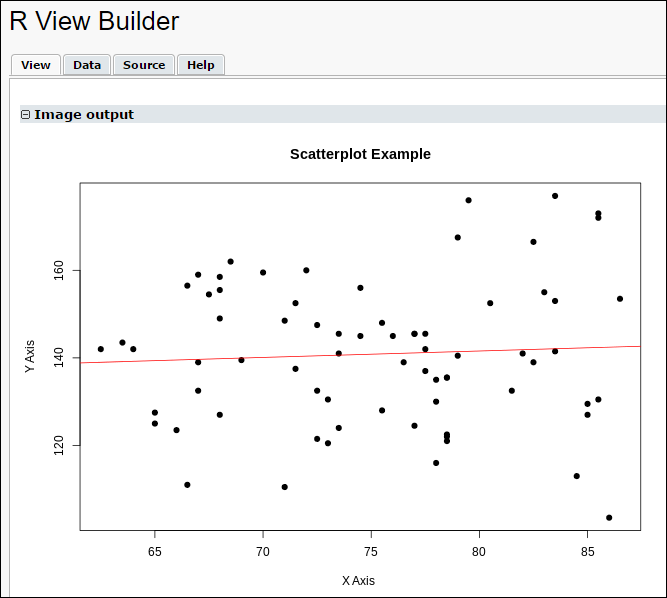
png(filename="${imgout:myscatterplot}", width = 650, height = 480);
plot(x, y, main="Scatterplot Example", xlab="X Axis ", ylab="Y Axis", pch=19)
abline(lm(y~x), col="red") # regression line (y~x)
- Identify the LabKey data columns that you want to be represented by the script, and load those columns into vectors. The following loads the Systolic Blood Pressure and Diastolic Blood Pressure columns into the vectors x and y:
x <- labkey.data$diastolicbloodpressure
y <- labkey.data$systolicbloodpressure

png(filename="${imgout:myscatterplot}", width = 650, height = 480);
plot(x, y, main="Scatterplot Example", xlab="X Axis ", ylab="Y Axis", pch=19)
abline(lm(y~x), col="red") # regression line (y~x)
- Click the View tab to see the result:

Find Simple Means
Once you have loaded your data, you can perform statistical analyses using the functions/algorithms in R and its associated packages. For example:
options(echo=TRUE);
names(labkey.data);
labkey.data$pulse;
a <- mean(labkey.data$pulse, na.rm= TRUE);
a;
Find Means for Each Participant
The following simple script finds the average values of a variety of physiological measurements for each study participant.
# Get means for each participant over multiple visits;

options(echo=TRUE);
participant_means <- aggregate(labkey.data, list(ParticipantID = labkey.data$participantid), mean, na.rm = TRUE);
participant_means;
We use na.rm as an argument to
aggregate in order to calculate means even when some values in a column are NA.
Click the
Report tab to see the output.
Create Functions in R
This script shows an example of how functions can be created and called in LabKey R scripts. Before you can run this script, the Cairo package must be installed on your server. See
Install and Set Up R for instructions.
Note that the second line of this script creates a "data" copy of the input file, but removes all participant records that contain an NA entry. NA entries are common in study datasets and can complicate display results.
library(Cairo);
data= na.omit(labkey.data);

chart <- function(data)
{
   plot(data$pulse, data$pulse);
};

filter <- function(value)
{
   sub <- subset(labkey.data, labkey.data$participantid == value);
   #print("the number of rows for participant id: ")
   #print(value)
   #print("is : ")
   #print(sub)
   chart(sub)
}

names(labkey.data);
Cairo(file="${imgout:a}", type="png");
layout(matrix(c(1:4), 2, 2, byrow=TRUE));
strand1 <- labkey.data[,1];
for (i in strand1)
{
   #print(i)
   value <- i
   filter(value)
};
dev.off();
Paste the above into the
Source tab, then click the
Report tab to see a set of pulse plots.
Access Data in Another Dataset
You can access data in another dataset (a dataset not loaded into labkey.data) through the Rlabkey library's selectRows, for example:
suppressMessages(library(Rlabkey))

mydata <- labkey.selectRows(
    baseUrl="http://localhost:8080/labkey",
    folderPath="/home/Demo Study",
    schemaName="assay.General.Nab",
    queryName="Data",
    viewName="",
    containerFilter=NULL)
