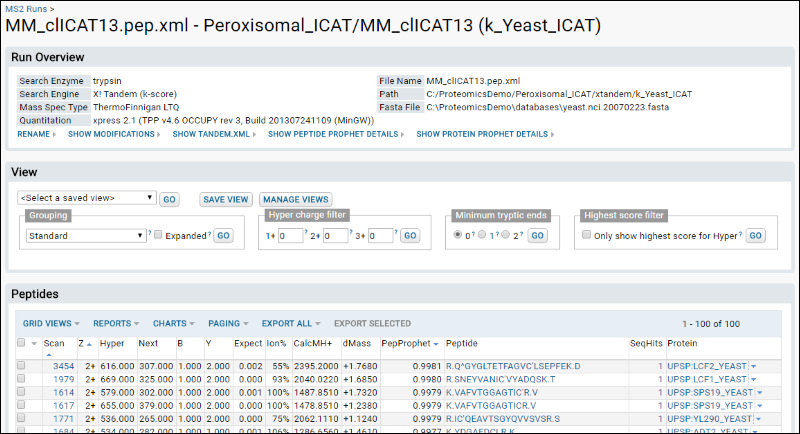
Now that the data has been searched and the results have been imported (including an X! Tandem search, PeptideProphet scoring, XPRESS quantitation, and ProteinProphet scoring), you can view the results.
View the PeptideProphet Results
- Refresh the MS2 Dashboard by clicking the "refresh page" button (or the F5 key) in your browser.
- In the MS2 Runs section, click Peroxisomal_ICAT/MM_clICAT13 (k_Yeast_ICAT).
View Peptide Details
- In the Peptides and Proteins section, under the Scan or Peptide columns, click a link for a peptide sequence.
- You'll see a page that shows spectra information, as well as quantitation results, as shown below.
- Experiment with the control panel on the left to control the visualizations on the right.

View Peptide Scores with Highest and Lowest Certainty
To view the peptides scored with the highest certainty by PeptideProphet:
- Click back to the results page for Peroxisomal_ICAT/MM_clICAT13 (k_Yeast_ICAT).
- In the Peptides section, locate the PepProphet column.
- Click the column heading and choose Sort Descending to see the scores with highest certainty.
- Choose Sort Ascending to see the scores with lowest certainty.

Manage Peptide Views
In the
Peptides web part, by selecting
Grid Views > Customize Grid, you can manage how peptide and protein data is displayed. Add, remove, or rearrange columns, then apply sorts and filters to columns. Once you've modified the grid to your liking, you can save it as a custom grid. Custom grids can be applied to any MS/MS data set, and can be public or private.

In addition to saving a custom grid, you can use options in the
View web part to specify more options for how to view peptides. In each section, select a value and click
Go.
- Grouping: offers options for aggregating peptide data. You can specify whether peptides are viewed by themselves or grouped by the protein assigned by the search engine or by ProteinProphet group. Options include:
- Standard offers access to additional data like protein annotations and experimental annotations using LabKey Server's Query interface.
- Protein Groups displays proteins grouped by ProteinProphet protein groups.
- The other three options are for backwards compatibility with previous versions of LabKey Server.
- Hyper charge filters: Specify minimum Hyper values for peptides in each charge state (1+, 2+, 3+).
- Minimum tryptic ends: By default, zero is selected and all peptides are shown. Click 1 or 2 if you only want to see peptides where one or both ends are tryptic.
- Highest score filter: Check the box to show only the highest score for Hyper.
The combination of grouping and filters can be saved as a named view by clicking
Save View in the
View web part. Select an existing view from the pulldown.
Click
Manage Views to open a page allowing you to select among views, specify default, and delete obsolete saved views.