To work with assay data, it is helpful to review some of the terminology used to describe the various grouping levels for assay data:
- Assay Results: The individual data elements from an instrument, for example the intensity of a spot or well. Assay instruments typically output a lot of results each time a sample is run.
- Assay Runs: Data imported representing a single instrument run, typically but not necessarily contained in a single file. An operator may be required to enter properties at the time of import, depending on the instrument type.
- Assay Batches: A set of runs uploaded in a single session; some properties may be common to the entire batch. A single run can still be considered a batch and still uses batch properties when uploaded by itself.
Assay Runs
Once you have uploaded assay data, you will be taken first to the Runs grid, which is the "middle" level grouping, between Results (the most detailed grid view) and Batches (the most general view).

The Runs grid provides a number of links to manage and explore the assay data:
- Clicking a link in the Assay Id column, such as "Run3", takes you to the Results grid.
- Clicking in the Flag column toggles the flag indicating there is a need to review the run for possible problems. When you flag a row, you may enter a comment. A flagged row shows a colored icon; hover to see the comment entered.
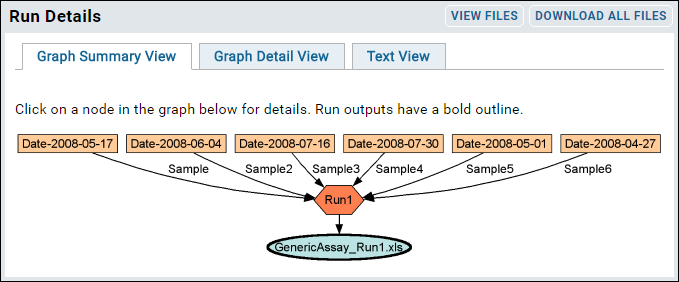
- Clicking the graph link (in the unnamed column between Flag and Assay Id) takes you to details about the run, including a graphical representation of the run. For example, clicking the graph link for Run1 shows the following. Notice that the graph assumes that each unique date in the assay data represents a different specimen.

- Return to the assay runs grid using the back button in your browser, or by clicking Assay Dashboard, then GenericAssay in the assay list.
Assay Results
The Results grid shows actual assay data originally encoded in the Excel files, now captured by the assay design.
- From the Runs grid, in the Assay Id column, click Run3.
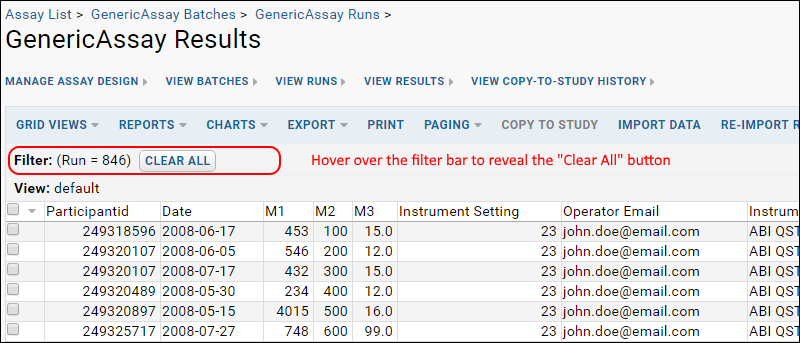
- You are taken to the assay Results grid. Only results for the selected run are shown. Notice the filter message above the grid reads "Run = 846" (or some other integer) instead of "Run3", as you might expect. The filter message uses the system value, which in this case was 846.
- To see all results across all runs, clear the filter:
- Hover over Filter and a button Clear All will appear. Click the button to clear the filter.

- Use the Results grid to create reports and visualizations.
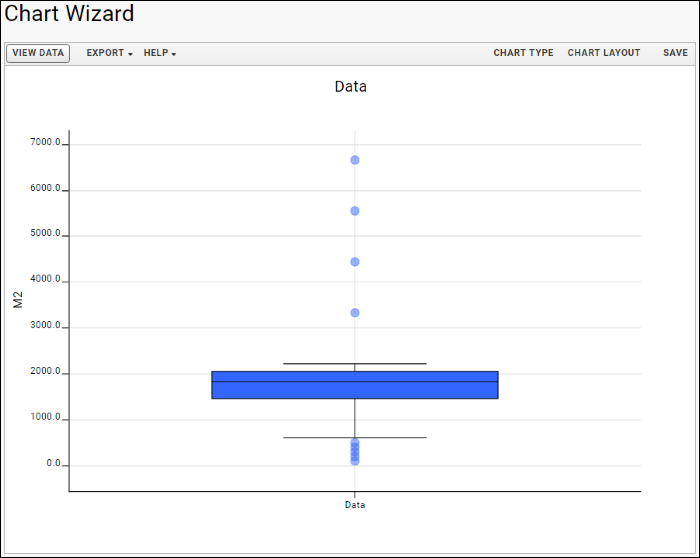
- To see LabKey Server's best guess visualization for the assay data, click one of the column headers M1, M2, or M3 and select Quick Chart. For the column M2, LabKey Server's best guess is a box and whisker plot that will look something like this:

- Explore the customizations available using the Chart Type and Chart Layout buttons.
- To return to the Results grid, click the Back button on your browser.
- There is much more you can do with the Results grid of assay data -- explore the buttons and menus above the grid, such as Grid Views, Reports, Charts, and Export.
Assay Batches
- From the Assay Dashboard, click GenericAssay, then View Batches to see a grid view of all batches imported.
- The batch grid can be customized, but by default shows the run count as well as properties specified on import.

- Click the batch Name to return to the runs grid, filtered to only show runs from that batch. (Note that if runs were deleted and imported as part of a later batch, the earlier batch will no longer show those runs.)


