Panorama provides a summary of all the data on this server acquired from each instrument. This
Instrument Summary also provides automatic links between data in Experiment folders and the QC folder(s) that contain data from the same instrument, making it quick to see how the instrument was performing at the time of acquisition.
Instruments Summary
The
Instruments Summary panel lets you see which instrument(s) acquired the data in a Skyline document. It is shown on the replicate page for a single Skyline document.

The summary lists, for each experiment in the folder:
- Instrument Name
- Serial Number
- Start/End Dates for the experiment
- Number of Replicates
- QCFolders: If any QC folders exist for the instruments and experiment dates, there will be one or more links here to go to the folder, where you will see a combined view of experiment and qc plot data.
Click a link in the
Serial Number column to see all data on this server acquired from this instrument. For example, clicking the "Exactive Series slot #2384" link in the image above:

Linked Experiment and QC Folders
A
Panorama folder of type "Experimental Data" provides a repository of Skyline documents, useful for collaborating, sharing and searching across multiple experiments.
A
Panorama folder of type "QC" contains quality control metrics of reagents and instruments.
When there is QC data for the instruments used in the experiments, users will find it helpful to navigate directly to the QC data around the time of experimental data acquisition to assess the performance of the instrument at the time.
Navigate the Combined Information

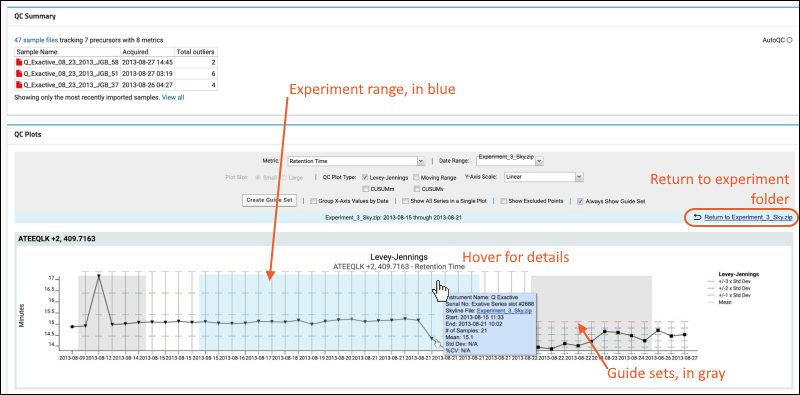
The experiment date range is shown in blue. Any guide sets applied or in the same time range will be shown in gray (overlapping sections will be a mixed darker shade).
In the blue bar above the plot, click
Return to Experiment to return to the experiment folder.
Related Topics
 The experiment date range is shown in blue. Any guide sets applied or in the same time range will be shown in gray (overlapping sections will be a mixed darker shade).In the blue bar above the plot, click Return to Experiment to return to the experiment folder.