View Utilization Calendar
In the
QC Summary panel on the
Panorama QC Folder dashboard, each instrument tile includes a link to
View all ## samples and utilization calendar .

The
QC Summary History page shows the
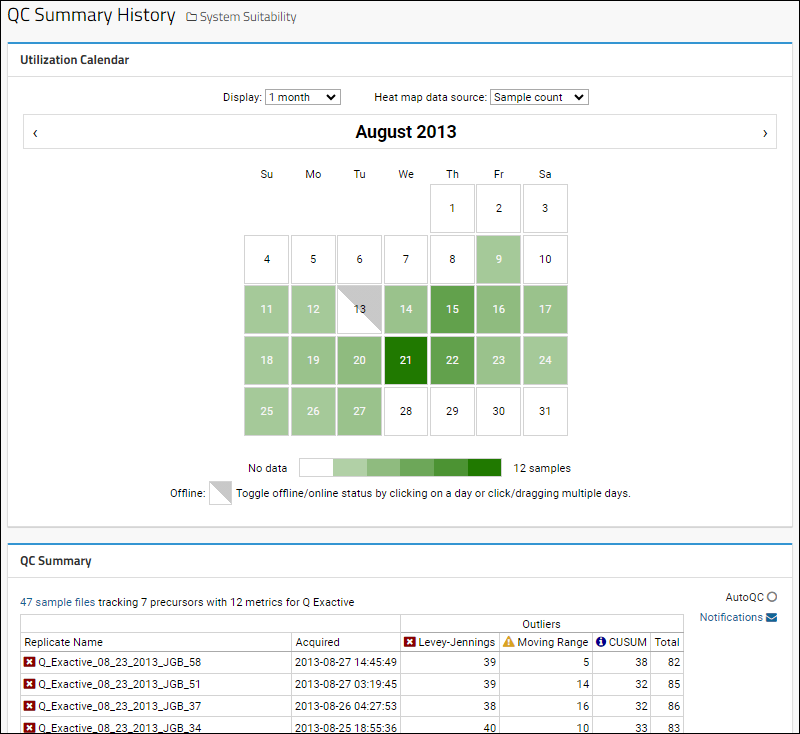
Utilization Calendar, a heat map showing days with more of the selected source as darker. There is a dynamic key along the bottom edge indicating what the current scale is. Any days on which the instrument has been
marked as Offline will be shown with a gray shade across half the box.

You can choose to display 1, 4, or 12 months of data in the heat map. The default is 1 month. Choose the
Heat map data source:
- Sample count
- Median outliers
Step through more months using the
and icons on the ends of the month-title bar.
An example to explore on PanoramaWeb:
Hover Details
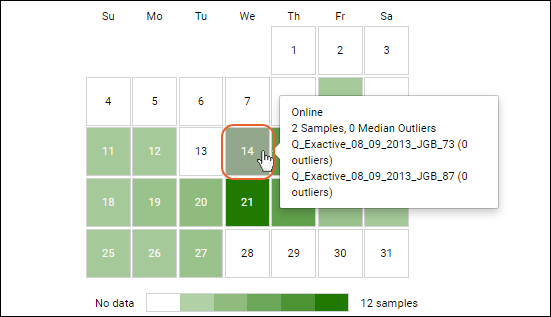
Hover over a cell to see the status as well as the samples and/or outliers that the shading represents.

Mark Days as Offline
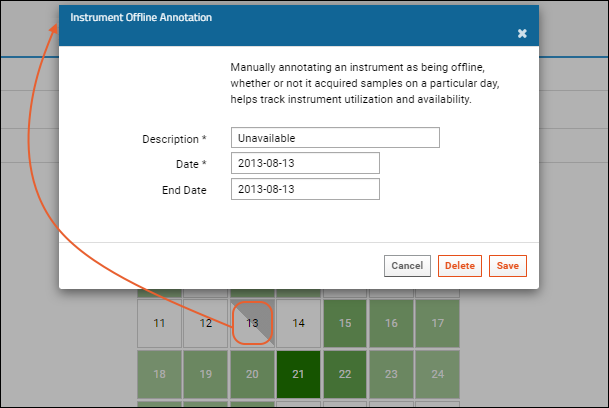
A user with the "Editor" role (or higher) can click (or click-drag to multiselect) in order to mark selected days as offline. Manually annotating an instrument as being offline, whether or not it acquired samples on a particular day, helps track instrument utilization and availability.

Enter a
Description and
Date, as well as an
End Date for a series of days.
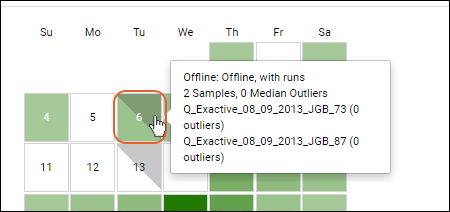
When there is data available on an 'offline' day, the gray shading will be on top of the heatmap color. Hover over any offline day to see the comment that was included, as well as a listing of the samples/outliers.

To remove an offline annotation, click it again and there will be a
Delete button to remove it.
Related Topics