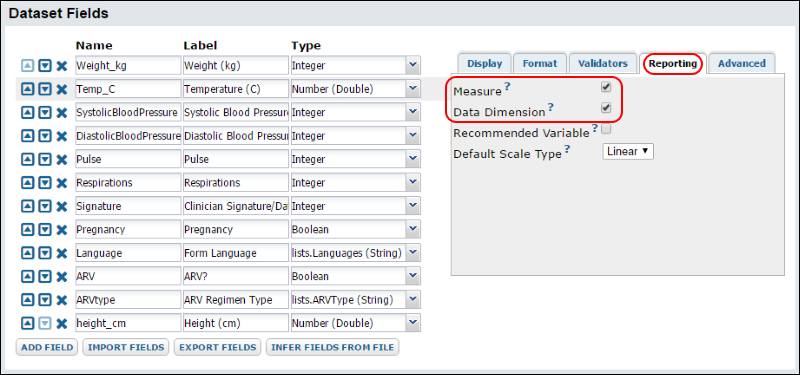
Your server may be restricted to offer only those columns that have been marked as data "measures" or "dimensions" for charting.
- Dimension: "dimension" means a column of non-numerical categories that can be included in a chart, such as for grouping into box plots or bar charts.
- Measure: A column with numerical data.
Note: Text columns that include
numeric values can also be marked as
measures. For instance, a text column that includes a mix of integers and some entries of "<1" to represent values that are below the lower limit of quantitation (LLOQ) could be plotted ignoring the non numeric entries. The server will make a best effort to convert the data to numeric values and display a message about the number of values that cannot be converted.
If your server restricts charting to only measures and dimensions, you have two options: (1) either mark the desired column as a measure/dimension or (2) turn off the restriction.
Mark the Desired Column as a Measure/Dimension
Note that you must have editor permissions to change a dataset/list design.
- Go to the dataset/list you wish to visualize.
- Click Manage for a dataset or Design for a list.
- Click Edit Definition for a dataset or Edit Design for a list.
- Select the column you wish to visualize.
- Click the Reporting tab.
- Place a checkmark next to either Measure (for numeric columns) or Dimension (for non-numeric columns).
- Click Save.

Turn off the Measure/Dimension Restriction
Note that you must have administrator permissions to change these settings.
- Go to Admin > Site > Admin Console.
- Click Look and Feel Settings.
- Scroll down to Restrict charting columns by measure and dimension flags.
- If you see a checkmark next to this option, remove it, and click Save.
Related Topics