Understanding Column Names
In the flow workspace, statistics column names are of the form "subset:stat". For example, "Lv/L:%P" is used for the "Live Lymphocytes" subset and the "percent of parent" statistic.
Graphs are of the form "subset(x-axis:y-axis)". For example, "4+(SSC-A:<APC-A>)" for the "4+" subset and the "side scatter" and "compensated APC-A" channels. Channel names in angle brackets are compensated.
Customize Your Grid View (Optional)
The columns displayed by default for a dataset are not necessarily the ones you are most interested in, so you can customize which columns are included in the default grid. See
Customize Grid Views for general information about customizing grids.
In this optional tutorial step, we'll show how you might remove one column, add another, and save this as the new default grid. This topic also explains the column naming used in this sample flow workspace.
- From the Flow Dashboard, click Analysis then labkey-demo.xml.
- Select Grid Views > Customize Grid.
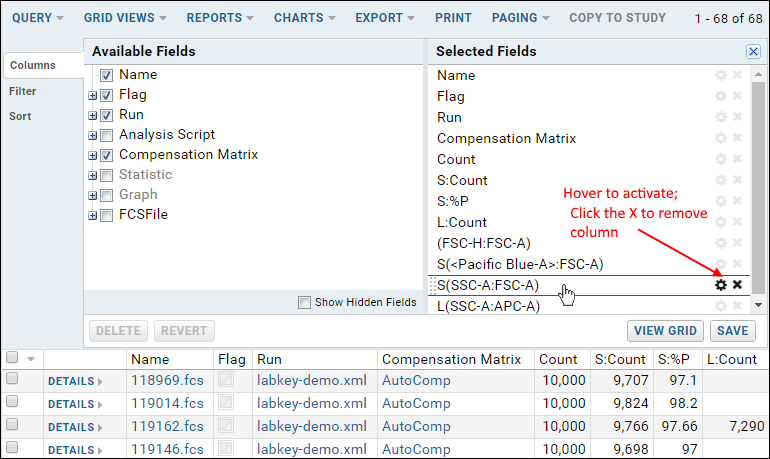
- In the Selected Fields pane, hover over "S(SSC-A:FSC-A)" (if present). Notice that you see a tooltip with more information about the field and the cog (rename) and x (remove) icons are activated.
- Click the X to remove the field.

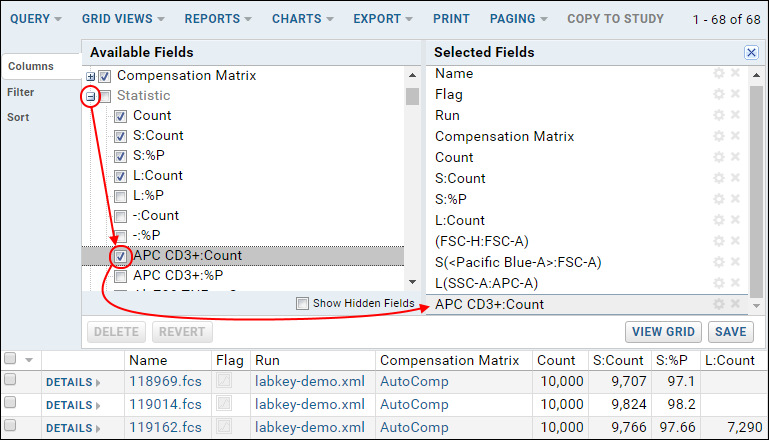
- In the Available Fields pane, open the Statistic node by clicking the '+' sign and place a checkmark next to APC CD3+: Count.

- Click Save.
- Confirm that Default grid view for this page is selected, and click Save.
You will now see the new column in the datagrid. Note that there is not very much sample data in it. Notice as well that the graph columns listed as "selected" in the grid customizer are not shown as columns. The next step will cover displaying graphs.
