After
importing ELISpot instrument data, you will see the list of currently uploaded runs. This topic guides your review of ELISpot data, using examples uploaded during the
ELISpot Assay Tutorial.
Explore Uploaded Data
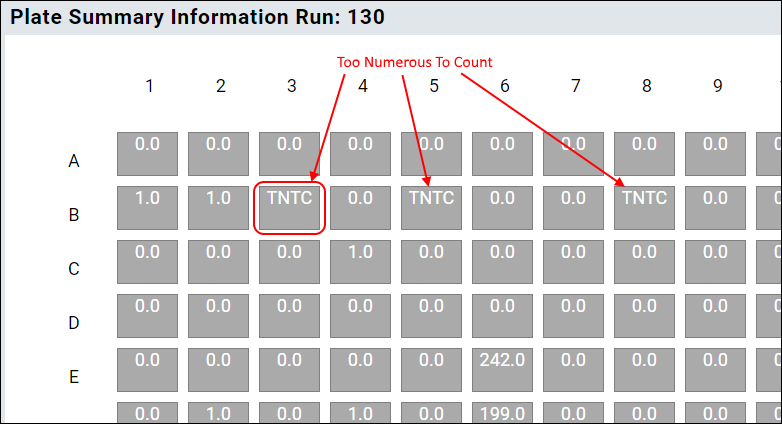
Handle TNTC (Too Numerous To Count) Values
ELISpot readers sometimes report special values indicating that a certain spot count in a given well is too numerous to count. Some instruments display the special value -1 to represent this concept, others use the code TNTC. When uploaded ELISpot data includes one of these special values instead of a spot count, the LabKey Server well grid representation will show the TNTC code, and exclude that value from calculations. By essentially ignoring these out of range values, the rest of the results can be imported and calculations done using the rest of the data.

If there are too many TNTC values for a given well group, no mean or median will be reported.
Background Subtraction
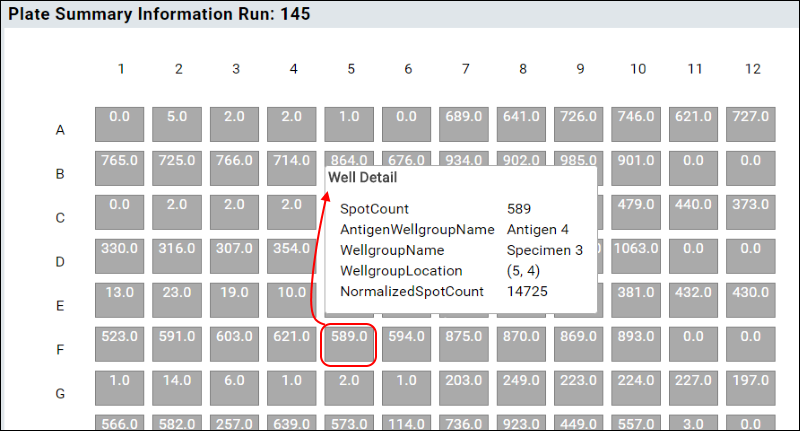
One option for ELISpot data analysis is to subtract a background value from measured results. When enabled, each specimen group will have a single background mean/median value. Then for each antigen group in the sample, the mean/median for the group is calculated, then the background mean/median is subtracted and the count is normalized by the number of cells per well.
Enable Background Subtraction
To enable background well subtraction, you first configure the plate template. The main flow of the tutorial did not need this setting, but we return there to add it now.
- Return to the Assay Dashboard.
- Click Manage Assays and then Configure Plate Templates.
- Open the plate template editor for "Elispot Template 1" by clicking Edit. Or Edit a copy if you prefer to give it a new name and retain the original version.
- On the Control tab, create a well group called "Background Wells".
- Select the wells you want to use as this background group.
- Save the plate template.
When an assay design uses a plate with background wells defined, the user can selectively choose background subtraction for imported data by checking the
Background Subtraction checkbox during import. When selected, background calculations will be performed. When not selected, or when the plate template does not specify a set of background wells, no background calculations will be performed.
On the ELISpot assay runs grid, there is a column displaying whether background subtraction has been performed for a run. The user can select runs in this grid, and then use the
Subtract Background button to start a pipeline job to convert existing runs:

Once background subtraction calculations have been performed, there is no one-step way to reverse it. Deleting and re-uploading the run without subtraction will achieve this result.

 Once background subtraction calculations have been performed, there is no one-step way to reverse it. Deleting and re-uploading the run without subtraction will achieve this result.