You can create different types of report and chart to view, analyze and display data using a range of visualization tools. These visualizations can be displayed and managed as part of a folder, project or study.
Report and Visualization Types
When viewing a
data grid, select
Charts > Create Chart menu to open the plot editor and create new:
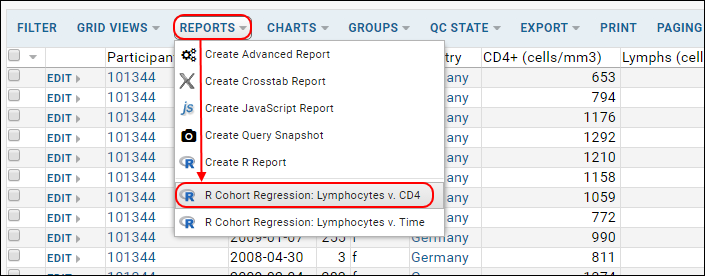
Use the
Reports menu to create:
To generate a quick visualization on a given column in a dataset, select an option from the column header:
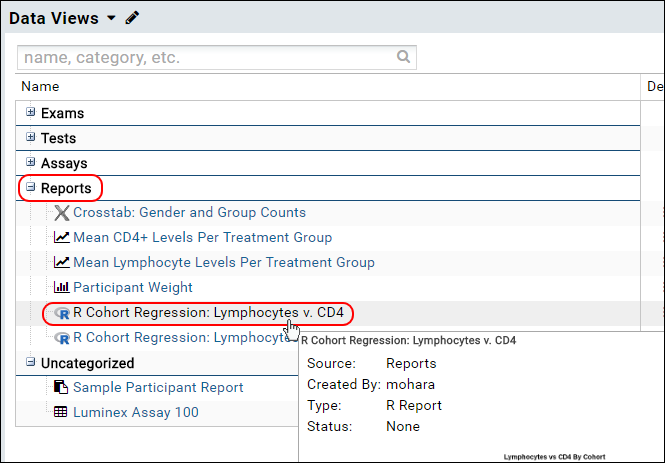
Other types of reports can be created from the
Data Views web part in a study:
Whether you can create a given type of report or chart depends on the level of access you have to the given folder and data.
Which columns are available for plotting may depend on the
measure and
dimension property for the column:
Manage Visualizations
Open a Saved Visualization
Once saved, visualizations are generated by re-running their associated scripts on live data. You can access a visualization either through the
Reports or Charts drop-down menu on the data grid, or directly by clicking on the name in the
Data Views web part.


Legacy Visualization Types
These visualization types are still available, but are no longer being actively developed.

