Conditional formats change how data is displayed depending on the value of the data. For example, if temperature value goes above a certain value, than you can specify that the value be displayed in bold, italic, red, etc. Conditional formats are declared on the Format tab of the field editor, found by editing the definition or design of your dataset, list, or assay.
Specify a Conditional Format
To specify a conditional format, select a field, click the
Format tab and click
Add Conditional Format.
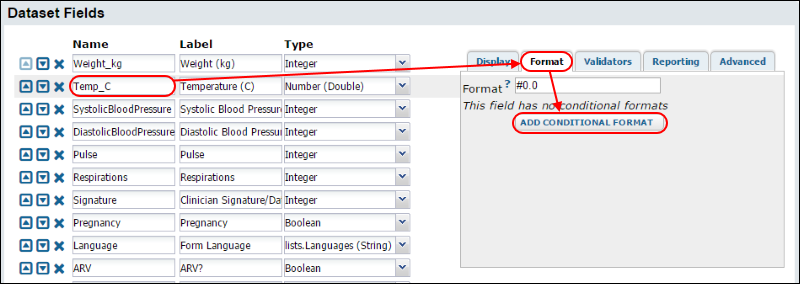
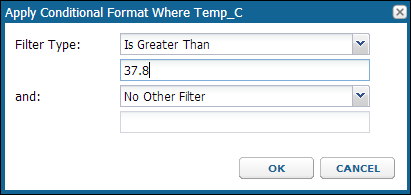
First identify the condition under which you want the conditional format applied. Specifying a condition is just like specifying a
filter.
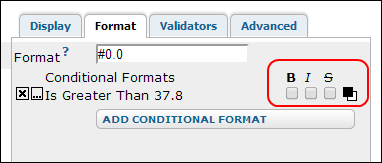
Next, you can specify how the field should be formatted when that condition is met. The options are:
- bold
- italic
- strikethrough
- color: click to popup a dialog for setting foreground and background colors
Multiple Conditional Formats
Multiple conditional formats are supported in a single column. Click
Add Conditional Format again to specify another conditional format.
If a data cell fulfills multiple conditions, then the first condition satisfied is applied, and conditions lower on the list are ignored. You can reorder the list of conditions by dragging and dropping items on the list.
For example, suppose you have specified two conditional formats on one field:
- If the value is 40 degrees or greater, then display in bold text.
- If the value is 39 degrees or greater, then display in italic text.
Although the value 40 fulfills both conditions, only the first condition to apply is considered, resulting in bold display. The values will be displayed as shown below:
41
40
39
38
37
Specify Conditional Formats as Metadata XML
Conditional formats can be specified (1) as part of a table definition and/or (2) as part of a table's metadata XML.
When conditional formats are specified in both places, the metadata XML takes precedence over the table definition.
You can edit conditional formats as metadata xml source. In the metadata editor, click
Edit Source. The sample below shows XML that specifies that values greater than 37 in the Temp_C column should be displayed the bold text.
<tables xmlns="http://labkey.org/data/xml">
  <table tableName="Physical Exam" tableDbType="NOT_IN_DB">
    <columns>
      <column columnName="Temp_C">
        <conditionalFormats>
          <conditionalFormat>
            <filters>
              <filter operator="gt" value="37"/>
            </filters>
            <bold>true</bold>
          </conditionalFormat>
        </conditionalFormats>
      </column>
    </columns>
  </table>
</tables>
Example: Conditional Formats for Human Body Temperature
In the following example, values out of the normal human body temperature range are marked red (too high) or blue (too low). In this example, we use the Physical Exam dataset that is included with the
importable demo study.
- In a grid view of the Physical Exam dataset, click Manage.
- Click Edit Definition.
- Select a field (in this case Temp_C), click the Format tab, and click Add Conditional Format.
- In the popup, choose Filter Type "Is Greater Than", enter 37.8, and click Ok.
- Click the black/white square icon to select colors:

- Select red in the foreground text panel (to indicate temperature is higher than normal).
- Click Ok.
- Click Add Conditional Format again.
- Choose Filter Type: "Is Less Than", enter 36.1, and click Ok.
- Again select a color format: this time choose blue foreground text (to indicate temperature is lower than normal), and click Ok.
- Scroll back up and click Save.
- Click View Data to return to the data grid.
Now temperature values above 37.8 degrees are displayed in red and those below 36.1 are displayed in blue. Note that other conditional formats may be applied to other columns. In this screencap, there is conditional formatting in the Systolic Blood Pressure column also: orange for high, and red for very high readings.
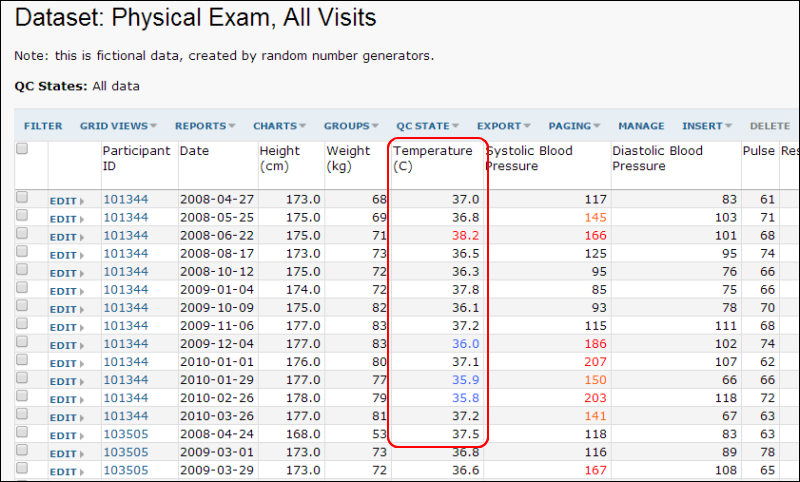
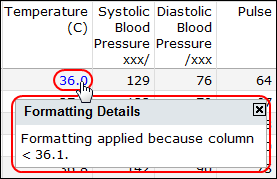
When you hover over a formatted value, a pop up dialog will appear explaining the rule behind the format.
Related Topics

 When you hover over a formatted value, a pop up dialog will appear explaining the rule behind the format.